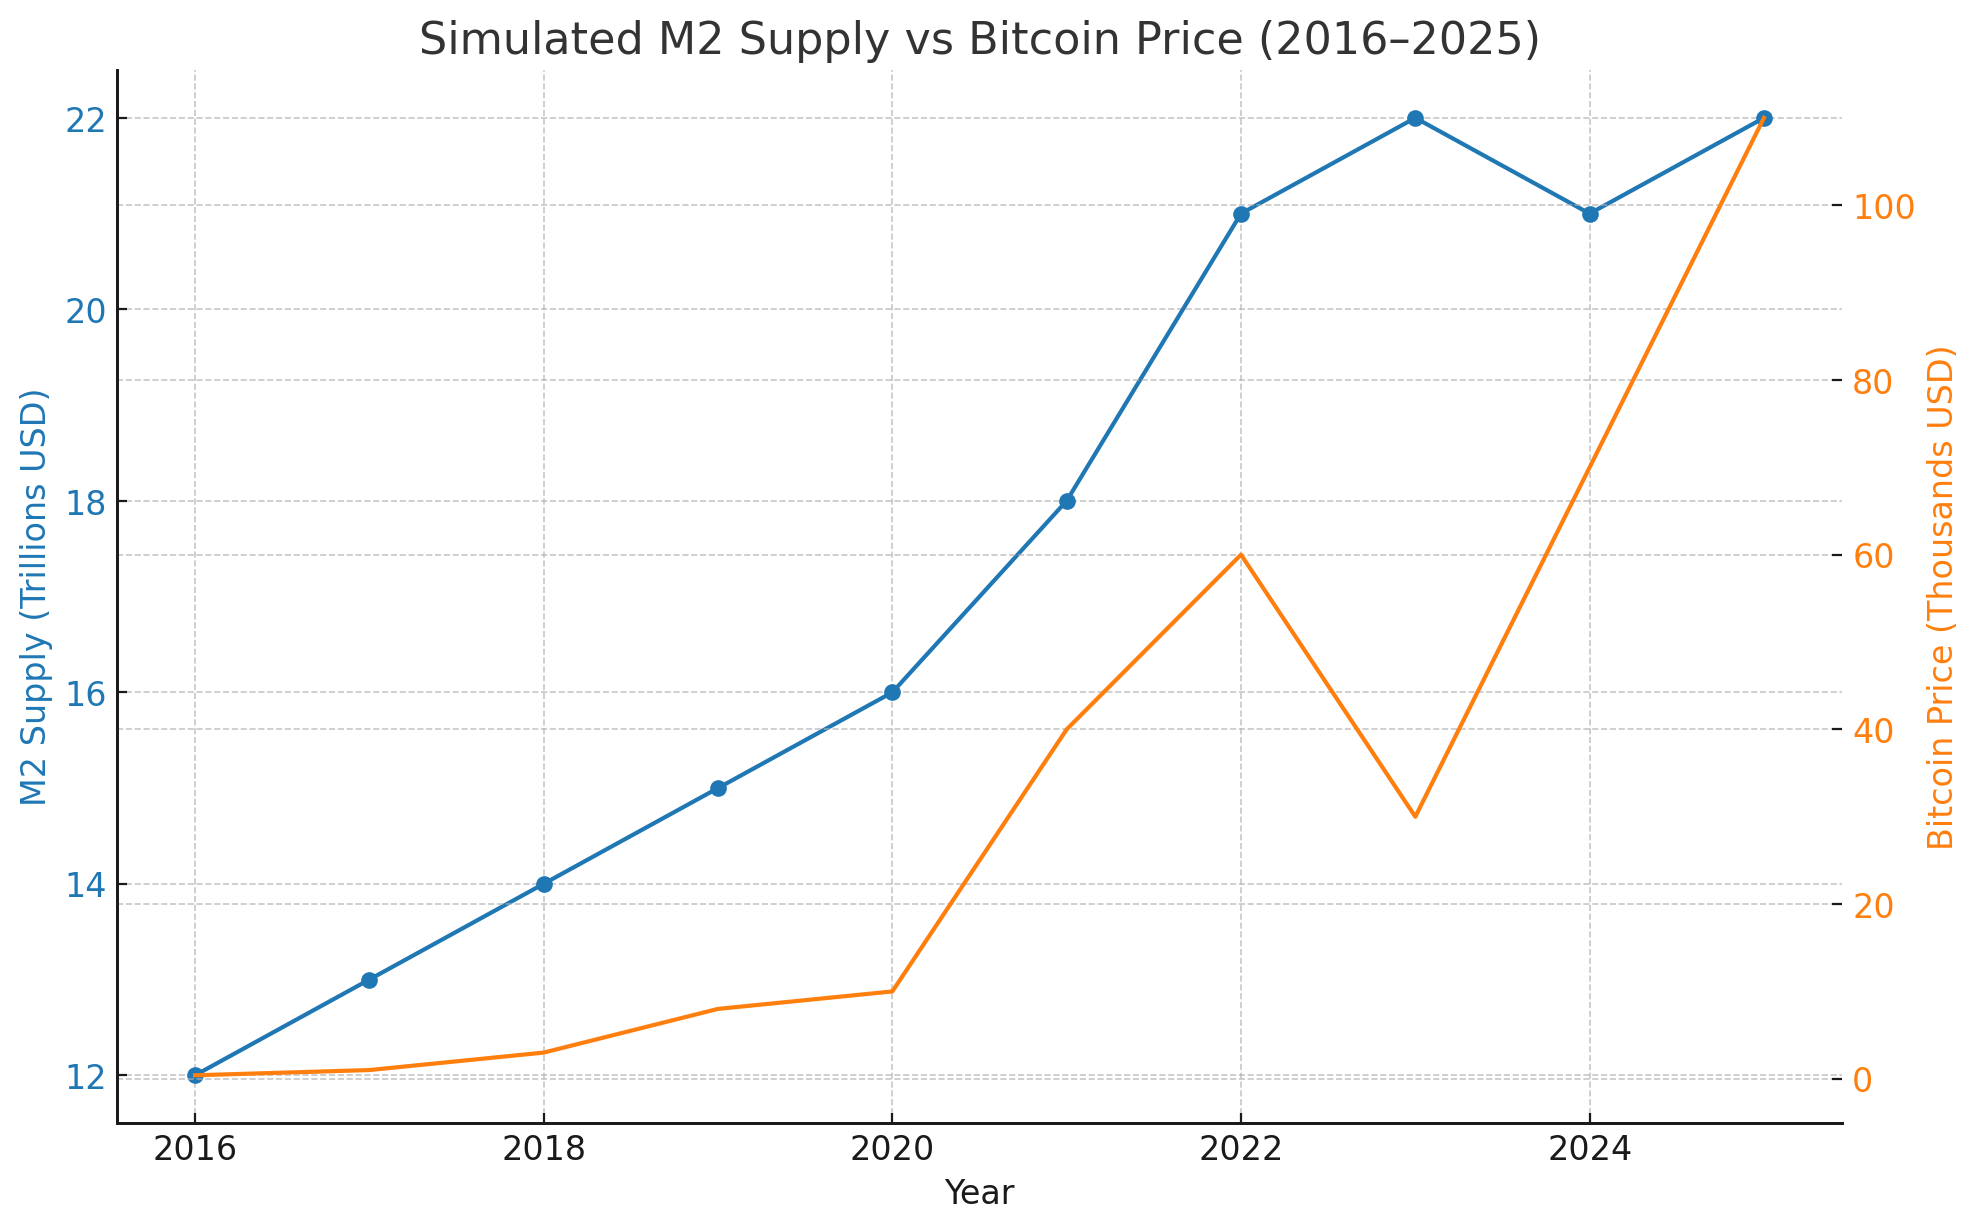
In recent years, the M2 money supply — a key measure of money circulating in the U.S. economy — has surged to unprecedented levels. This expansion is closely watched by economists, investors, and especially crypto enthusiasts. Bitcoin, often branded as “digital gold,” has shown a notable correlation with liquidity trends, including M2 growth. As the chart shows, U.S. M2 has climbed from under $10 trillion to over $22 trillion in less than a decade, reflecting massive monetary expansion.
Understanding M2 Money Supply
M2 includes cash, checking deposits, and easily convertible near money such as savings accounts and money market securities. It’s a broader measure of liquidity than M1 and is often used to gauge monetary policy’s impact on the economy.
- Rapid Growth: During crises (especially 2020–2021), the Federal Reserve injected liquidity, pushing M2 higher.
- Liquidity Indicator: When M2 grows, it means more dollars are circulating, often fueling higher prices for assets including stocks, real estate, and crypto.
Bitcoin’s Performance Against M2
Historically, Bitcoin has benefited from monetary expansion:
- Scarcity vs. Inflation – As central banks print more money, the relative scarcity of Bitcoin (fixed at 21 million) becomes more appealing.
- Inflation Hedge Narrative – Investors increasingly view Bitcoin as a hedge against the debasement of fiat currencies.
- Liquidity-Driven Risk Appetite – When liquidity is abundant, risk-on assets like Bitcoin tend to rally alongside equities and tech stocks.
Conversely, when M2 slows or contracts, markets often tighten, risk appetite declines, and Bitcoin can see increased volatility or downward corrections.
The Correlation in Practice
Looking at the chart you provided (M2 Money Stock), we can see:
- Steady Growth Pre-2020: M2 grew gradually, and Bitcoin had cyclical bull runs tied to halving events and liquidity cycles.
- Explosion Post-2020: A huge spike in M2 coincided with Bitcoin’s rally to $69,000 (2021).
- Flattening & Slight Decline (2022–2023): When the Fed tightened policy, Bitcoin entered a bear market.
- Renewed Uptick in M2 (2024–2025): This hints at potential support for another Bitcoin rally if liquidity continues to rise.
Why This Matters for Investors
- Macro Awareness: Monitoring M2 trends can give early clues about Bitcoin’s potential direction.
- Rate Cuts & Liquidity: When central banks cut rates, M2 often expands again, which can be bullish for Bitcoin.
- Volatility Management: Understanding liquidity conditions helps traders manage leverage and risk exposure.
Key Takeaways
- M2 Expansion = More Fuel for Bitcoin: As dollars increase, scarce assets like Bitcoin become more attractive.
- M2 Contraction = Potential Pressure: Tightening liquidity can dampen Bitcoin’s price performance.
- Long-Term Narrative Remains Strong: Bitcoin’s fixed supply still appeals to investors wary of money printing.
Conclusion
The M2 money supply is not just a dry macroeconomic statistic — it’s a powerful driver of asset prices across the board, including Bitcoin. By tracking liquidity trends, investors can better anticipate Bitcoin’s major moves. As we move deeper into an era of rate cuts and shifting monetary policies, the relationship between M2 and Bitcoin will remain one of the most important macro correlations in the crypto space.